4-2. Launching a MUSTIG simulation
4-2-1. Selecting the elements to calculate
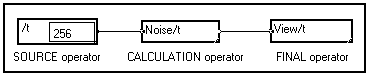
A MUSTIG program is a graph made out of several elementary boxes called macros or modules, linked together with wires. A graph is composed of :
When the graph is built no calculation is performed : Mustig only checks the consistency of the graph to prevent, for example, two outputs from being directly linked together.
At any step of the creation of the graph, it is possible to ask for a calculation to ensure that a particular step of the algorithm is correct, or to exploit the results.
4-2-1. Selecting the elements to calculate
MUSTIG allows to carried out partial simulations. That is, you do not have to launch a global simulation like in many other graphical simulation languages : you can select a portion of the graph and run this portion only.
What elements may be calculated ?
The elements from which you can launch a simulation are the final elements : you must thus select a macro or a window which contains final elements. The most current final modules, a partial list of which is shown below, are found in the Outputs section of the Library :
|
|
General purpose scalar or vector or text display module. The number of elements and the number of visible digits depend on the size of the windows. |
|
|
Displays a vector of numerical data as a graph. All the options (colors, texts, type of line, type of display, etc) are set by double-clicking on the box. The name of the variable can of course be changed by clicking on it. |
|
|
Displays two incoming vector signals x(t) and y(t) as a (x,y) cloud of points. |
|
|
Displays a two-dimensionnal signal f(t,x). The type of displays, colors, type of lines, etc are set by double-clicking on the macro. |
|
|
Generates a graphical window in which drawings are performed. The calculation can be asked from this module or from the associated graphical window. |
|
|
Calculates a portion of the graph without displaying anything. |
Many other final modules are available in the Library : check their online help (Alt+H) to know their characteristics and how they should be used.
How to define the box(es) to calculate ?
Single box
If you want to select a single terminal macro, such as View/t for example, just left-click on it to select it. The selected element is framed with a thicker red line.
Grouped boxes
If you want to calculate several final macros simultaneously, you must first draw a box around them (see Creating a box), and select this entire box by left-clicking on its border or on a free space inside the fence :
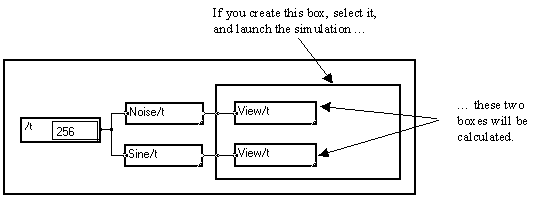
Reminder : Creating boxes (fences)
To create a fence, click on a corner of the fence to draw and move the mouse cursor to the other corner, framing all the boxes you want to include. When the size is OK, release the mouse button to validate and create the fence. To delete the fence without deleting the boxes inside, drag it by a corner and resize it so that it becomes tiny : the fence disappears.
Window
You may select the whole content of the window by just left-clicking on a free space of the window. The border of the window is framed with a thicker red line.
What elements of the graph are calculated ?
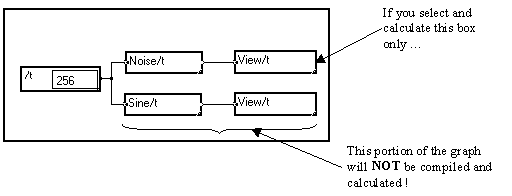
In order to compile the graph into machine code, MUSTIG starts from the selected final elements and goes upstream towards the source operators in order to spot which modules are involved in the calculation of the selected items. The parts of the graph which are not involved in the calculation asked for by the user are not taken into account.
It is thus very important to notice that only the portion of graph necessary to calculate the selected modules will actually be compiled and run. An example is shown below :
4-2-2. Launching the simulation
Once the elements to calculate are selected, select the Calculate command in the Calculations menu : the selected box is calculated.
You may also directly right-click on the element to calculate (a module, a macro, a window, an image window, a box drawn around several boxes) : the simulation will be launched. This shortcut is commonly used to launch a simulation and does not require the box(es) to calculate to be selected first. Just directly right-click on the box to calculate, no matter whether it is a single macro, a fence, or a window.
How is the simulation performed ?
In fact, a two-step process is invoked when you ask for a calculation :
Step 1 : Optimized compilation
The portion of the graph which is necessary to calculate the results you asked for is detected and compiled into machine code by the MUSTIG compiler. The strategy is based on the "cost" of the calculation. The compilation process is very fast (most of the time you won't even see it !), so that using MUSTIG is really comfortable, even if you have to launch lots of simulations.
In the case of multiple loops, the order of these loops is chosen so as to obtain a minimum storing volume, independently from the graphic overlapping loops. Some intermediate results are kept during the calculation so as to use them again when interactive modifications of the graph are performed.
Step 2 : Calculation
Once the compilation process has been completed successfully, the generated code is automatically executed and the results are displayed.
If the selected box is a scalar or vector numerical display module it fills up with the proper value(s).
If graphical displays are involved, specific windows open. However, if the calculated graphical windows had previously been slid to front panels or image windows, only these images are updated : the original graphical window does not open again.
For long simulations, the status of the calculations is shown in percentages in place of the Calculations menu on the top bar on the Mustig window (PC & Mac). On UNIX systems, the status is indicated by a graphical bar. This allows you to evaluate how much time the simulations will take. Be aware that this estimation does not take into account the external routines (DLLs) you may have included in your algorithm.
If MUSTIG detects any inconsistency while trying to compile the graph into machine code, for example if you try to add a 256 points signal to a 257 points signal, an error message is displayed, indicating the type of the error.
The erroneous part of the graph (box or pin) is shown. If the erroneous element is inside a macro not opened, you must open the selected macro (by typing Ctrl+I for instance, or double-clicking) to obtain a more precise localization of the error, and so on until the final element is selected.
Several options can be set in the Edit / Options / Calculations menu to modify the behavior of MUSTIG during the simulations.
If a beep occurs when you close the window after having modified a parameter, it means that the modification has been refused. Try clearing the whole program (see Clearing a box) before changing the calculation option. In some cases it may be necessary to exit MUSTIG, run it again and change the calculation options only then. If the value you enter is still not accepted, it means that this value is wrong.
Size of Data (Kbytes)
This option controls the amount of memory reserved to handle the data during the simulations. The default value is 0, meaning that MUSTIG tries to manage the memory by itself. If a large amount of memory is required (for example if the Out of memory error message is displayed during a simulation), set an appropriate value in Kbytes. Enter for example 25000 to reserve 25 Megabytes of memory for data. It is recommended that the specified size be smaller than the size of the available memory, to prevent the computer from swapping.
Time threshold for automatic recalculation (0 to 255)
This is a main features of MUSTIG's : each time you carry out any modification on a box, all the modules downstream are either reset or recalculated, depending on which value is entered in this option.
A small value indicates that only the modules needing brief calculations will be updated. The modules for the calculation of which a longer time is necessary will simply be reset.
On the other hand, a large value indicates that even the modules needing long calculations will be updated when the graph is modified. This may be awkward if the simulations you carry out are long and you are still tuning up your algorithm : the slightest change in the graph will lead to a long simulation.
A particular value is 0 : no recalculation will be performed when the graph is changed. All the downstream modules will simply be reset.
However, if the Automatic recalculation option is checked in the Calculations menu, all the calculations will be performed again when the program is modified, whatever the value of this option.
Vectorization (0, 1 or 2)
This parameter controls the type of machine code produced by the MUSTIG compiler. The execution time is often better with a maximum vectorization parameter (2) but the amount of required memory is larger. If the amount of available memory is not very large compared to the amount of memory required for processing the data, try setting this parameter to 1. Some programs may work only with a vectorization parameter equal to 1.
Size of program code (Kbytes)
Defines the amount of memory reserved for the compiled code produced by MUSTIG. Try increasing this value if the Code too big error message occurs.
Stack size (MAC users only)
Sets the size of the stack. Try increasing this value if the Saturated compiler error message occurs.
4-2-3. Stopping the simulation
If the simulation is carried out on a finite number of samples, it will eventually stop by itself. You may however stop the simulation before completion by clicking anywhere in the MUSTIG window.
If the simulation is carried out on an infinite number of samples (length of at least one signal equaling -1 means infinite simulation), you have to explicitly stop it by clicking anywhere in the Mustig window.
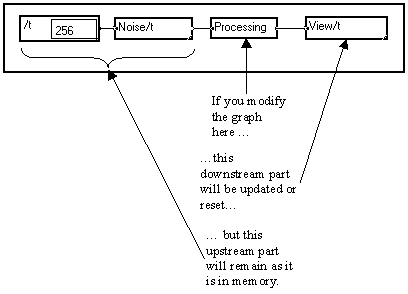
Update process when the graph is modified
When the graph is modified at a given place, the principle of MUSTIG is to keep in memory any result upstream is order to save time during the next calculation. The first pin upstream the modification is considered as the new source. This means that when you ask for a calculation again, the modules upstream the last modification of the graph will not be recalculated :
Update process when a final module is reset
If you just reset the View/t macro (see Resetting a calculated box) in the above example, or if you change its parameters without changing the upstream graph, and then ask for recalculation, MUSTIG will only redisplay the graph without recalculating the results.
That is, the output of the Processing macro is kept in memory when the View/t box is reset, it is NOT recalculated.
Thus, if some modules in your application require to be updated before each simulation (e.g. time management modules, or random seeds if you want to obtain another noise signal, etc), you have to explictly reset them (see Resetting a calculated box).
Controlling the automatic update process
This is a main features of MUSTIG's : each time you carry out any modification on a box, all the modules downstream are either reset or recalculated, depending on which value is entered in the Edit / Options / Calculations / Time threshold for automatic recalculation option. This strategy allows an interactive run, both fast and reliable as not all calculations are executed again at each request and as the visualized results always depend on the graph present-state. See Time threshold for automatic recalculation in the Menus chapter for more detailed information.
However, if the Automatic recalculation option is checked in the Calculations menu, all the calculations will be performed again when the program is modified, whatever the value of this option.
4-2-5. Clearing (resetting) a calculated box
As shown is the above paragraph, you do not have to reset the downstream boxes manually when you modify the graph : this is done automatically. In addition, if a previously used data file is modified, MUSTIG automatically detects that the date of the file has changed and updates the results accordingly.
However, in some cases you may want to reset a previously calculated box manually, especially if the latter is located upstream. This is particularly useful when working with random or time data.
As a matter of fact, when a modification is performed and / or a recalculation is asked for, only the modules that have undergone a change and those located downstream are actually recalculated. This may be awkward for some applications, so this is something you should be aware of.
Consider the example below where a gaussian pseudo-random number is generated :
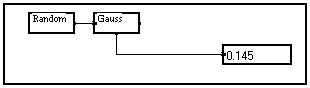
If we insert a module after the Gauss box and recalculate the display module (right-click), the display module is updated, but the random "seed" provided by the Random module is not :
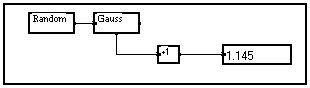
If we do not insert any new module, but simply delete and restore the link between the Gauss module and the display module, the behavior is the same : we have not generated another random number for the "seed" has not been modified. Thus, the generated random number is always the same !
To generate another individual random number, we have to explicitly reset the Random box. This is done by selecting it and choosing the Clear the box command in the Calculations menu.
A consequence of this behavior you should be aware of, is that if you use a Noise/t macro in your applications, the noise signal remains unchanged until you explicitly reset it using the Clear the box command.
You may use the Clear the box command on any box or window when you want it to be recalculated : a graphical window, a module on a front panel, a macro, or even the main program window.
4-2-6. Infinite or real-time simulations : precautions to take
Defining an infinite simulation
You may create a program that runs until the user clicks on the MUSTIG window to stop it. This allows to observe the simulation dynamically, which is very useful for some applications. It also allows infinite data acquisition runs to be launched.
If the length of a variable is -1, MUSTIG handles it has an infinite variable and thus the simulation is infinite.
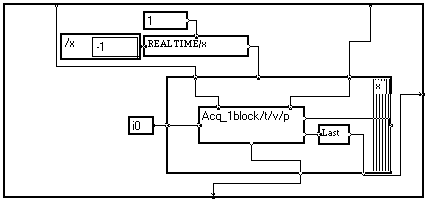
The REAL TIME/t module from the Variable changes section of the Library allows to process a variable as a signal of infinite length :
![]()
You should make sure not to use modules that expect a finite length signal in your programs, otherwise the simulation could not be stopped, even by clicking on the MUSTIG window ! Examples of such modules are : Max/t, Min/t, Last/t, etc.
Be aware that some Library macros use such modules. For instance, if you use the standard View/t 1D view macro with the Automatic normalization mode on (default) instead of the manual normalization mode, MUSTIG tries to calculate the boundaries of the signal, which is not possible for the signal is infinite !
Each time a graphical display is made, MUSTIG checks the status of the mouse to detect whether the user has clicked on the MUSTIG window to stop the simulation. If so, the simulation is stopped.
If you a loop according to a variable of infinite length is present in your program but no graphical display is made, you should tell MUSTIG to check the status of the mouse regularly by inserting the Last module in your graph, inside the loop. The example below, dedicated to infinite data acquisition, shows it :
Some output macros are designed especially for infinite signals. They are located in the Outputs / Real Time section of the MUSTIG Library. Check out their online help (Alt+H) to know how they should be used.
![]()
![]()
![]()
![]()
Controlling the order of execution in case of parallel or multiple graphs
There is something you should be aware of if your graph has some parallel patterns :
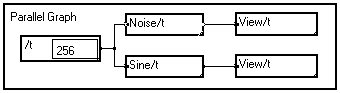
or if it is made of several independent graphs :
In all the above cases, you do NOT control which part of the graph, or which branch, will be executed first.
Most of the time, especially if you work with finite signals, you do not have to care about this : the final results will be the same whatever the order of execution.
In some particular cases however, this is awkward and you have to synchronize the different modules artificially to impose an order during the execution. You will have to think of this if you create custom data acquisition programs from MUSTIG, or if you use time information in you programs.
Synchronization is done by creating an artificial dependence between the parts of the graph, or between the different graphs.
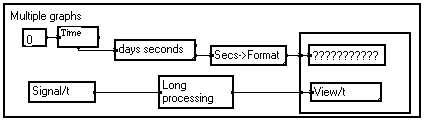
Example : The multiple graph below
displays the graphical result of a long processing and also the time of the day. But as no synchronization process has been included, the indicated time may either be the time BEFORE the long processing, or the time AFTER it : you cannot control it. There is no way to know which operation (the long processing or the time calculation) has been executed first.
If you want the indicated time to be the time AFTER the long processing has been completed, you have to find a way to impose the appropriate order with no ambiguity. A good way to do this is to force MUSTIG to wait for the result of the first calculation before starting the second one. If you modify the above graph so that it looks like this :
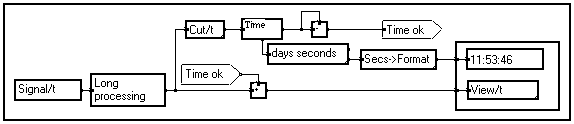
The long processing is carried out. Then, a sample is extracted from the output results to form the input value of the Time module. The latter asks the operating system for the current time of the day and puts the answer on its bottom pin. It returns an value on its right pin. This value is changed to zero by subtracting it to itself. A jump module is used to add this zero value to the output data of the long processing. Therefore, you are sure that the time calculation is performed AFTER the long processing, and BEFORE the display process (which can be long if the signal has a huge number of samples).
Some synchronization tricks of this kind must always be included in the graph each time you want to control in which order the modules must be executed.